The 5-Level Grid: A Mathematical Approach to Asset Accumulation
The Strategy
This grid system uses geometric position scaling across five predetermined levels, each triggered by 50% drawdowns from the previous level. By allocating a maximum 3% of capital per asset and scaling positions exponentially, the strategy systematically accumulates assets during significant market declines.
Bottom Line: The mathematical structure is so powerful that it can generate profits even on fundamentally broken assets, transforming market crashes into systematic accumulation opportunities.
Critical Reality Check: This strategy can lose money if assets continue declining below your weighted average cost. You can still lose significant amounts if positions go to zero or near-zero. Never use borrowed money or risk more than you can afford to lose entirely.
The 5-Level Grid Framework
This strategy operates on pure mathematical principles: geometric position scaling concentrates the majority of your capital at the lowest price levels, creating a cost average that's heavily weighted toward distressed prices.
Grid Structure:
- Capital Allocation — Maximum 3% of total capital per asset
- Level Spacing — Each level triggered by 50% drop from previous level
- Position Scaling — Geometric progression: 1x, 2x, 4x, 8x, 16x
- Mathematical Result — 77.4% of capital deploys in bottom two levels
Practical Example:
Stock peaks at $100 (all-time high). Your 3% capital allocation = $10,000.
- Level 1 ($50): Deploy $323 (1x position)
- Level 2 ($25): Deploy $646 (2x position)
- Level 3 ($12.50): Deploy $1,292 (4x position)
- Level 4 ($6.25): Deploy $2,584 (8x position)
- Level 5 ($3.13): Deploy $5,168 (16x position)
Total deployment: $10,013 across five levels with average cost of $7.36 per share
The Mathematical Power: It Works on Everything
The geometric scaling is so mathematically powerful that it can generate profits even on fundamentally weak assets. This isn't about picking winners - it's about mathematical structure creating advantage through severe drawdowns.
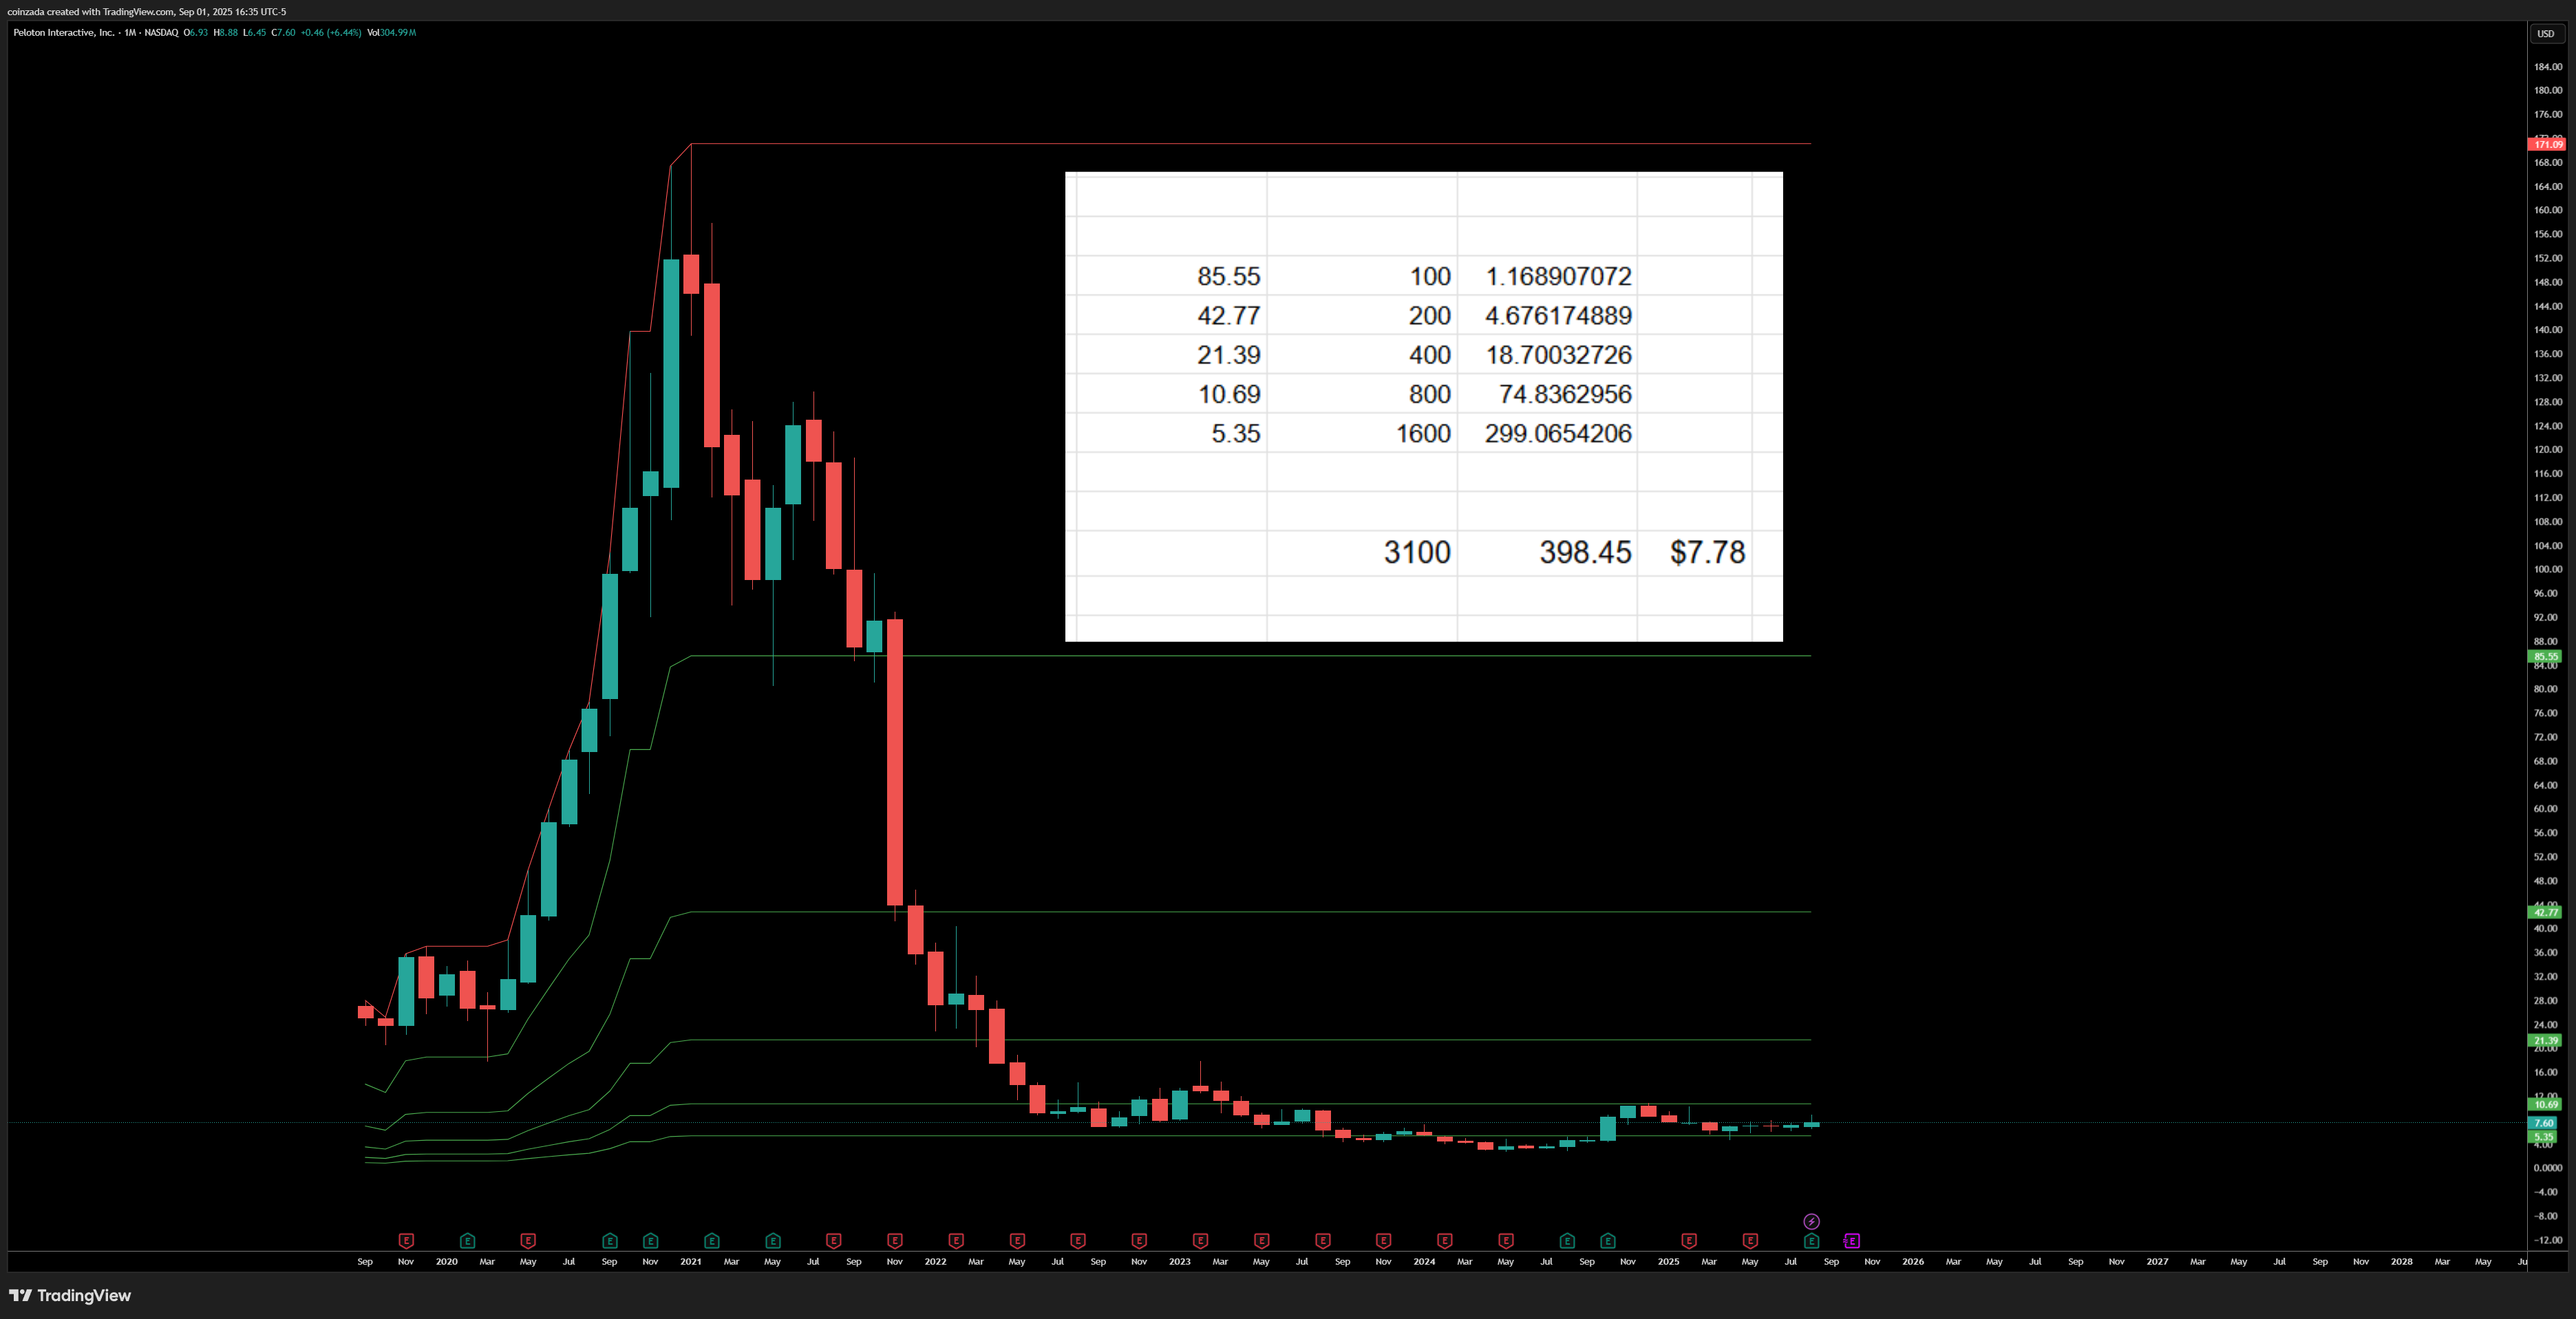
Real Example - PTON (Peloton):
PTON peaked at $171 and crashed 95% to current levels around $7.78. A grid strategy would have triggered all five levels:
- Level 1 at $85.55 (1x position)
- Level 2 at $42.77 (2x position)
- Level 3 at $21.39 (4x position)
- Level 4 at $10.69 (8x position)
- Level 5 at $5.35 (16x position)
Weighted Average Cost: $7.36 per share
Current Price: $7.78
Overall Result: +5.7% profit on the entire position, despite PTON being fundamentally broken and down 95% from its peak.
The Mathematics of Accumulation
The 50% drawdown levels ensure meaningful price separation between entries, while the geometric scaling (1x, 2x, 4x, 8x, 16x) concentrates capital at the most attractive levels.
Total Position Size = 1x + 2x + 4x + 8x + 16x = 31x base units
Bottom Two Levels = 24x out of 31x = 77.4% of total capital
Average Cost = Heavily weighted toward lowest prices
This structure means that even if assets don't recover fully, the mathematical weighting can still generate profits as long as there's some recovery from the absolute bottom.
Grid Deployment Strategy
The key is calculating your position sizes before any levels trigger. This removes emotion and ensures disciplined execution when markets are in freefall.
Position Size Calculation:
Start with your 3% capital allocation, then work backwards:
- Total allocation ÷ 31 (sum of scaling factors) = Base position size (1x)
- Level 1: 1x base position
- Level 2: 2x base position
- Level 3: 4x base position
- Level 4: 8x base position
- Level 5: 16x base position
Level Triggers:
Calculate all levels from the asset's all-time high:
- Level 1: 50% drop from ATH
- Level 2: 75% drop from ATH
- Level 3: 87.5% drop from ATH
- Level 4: 93.75% drop from ATH
- Level 5: 96.875% drop from ATH
Asset Spectrum: From Conservative to Speculative
The mathematical structure works across asset types, but risk-adjusted returns vary significantly. Choose based on your risk tolerance and conviction level.
Asset Categories (Conservative to Speculative):
- Blue Chip Stocks — Highest probability of recovery, best risk-adjusted returns
- Sector ETFs — Diversified exposure, reduced single-company risk
- Growth Stocks — Higher volatility, amplifies grid effect
- Fallen Angels — Former quality names, mixed outcomes
- Cryptocurrencies — Extreme volatility, highest risk/reward
- Speculative Stocks — Math still works, but higher failure probability
When the Strategy Fails
The strategy can lose money in two scenarios: assets declining below your weighted average cost, or complete asset failure. Understanding these limits is crucial for proper risk management.
Failure Scenarios:
- Continued Decline — Asset drops below your cost average and stays there
- Bankruptcy/Delisting — Complete loss of asset value
- Regulatory Ban — Asset becomes illegal to hold
- Technology Obsolescence — Permanent demand destruction
Assets to Avoid:
- Leveraged ETFs — Built-in decay destroys value over time
- Options — Expiration creates binary outcomes
- Penny Stocks — High delisting/bankruptcy risk
- Individual Commodities — Can face permanent demand destruction
Risk Management and Portfolio Construction
The 3% allocation limit is critical for portfolio survival. Even if some positions fail completely, the mathematical structure limits damage while allowing substantial upside from successful positions.
Portfolio Construction:
- Maximum 3% per asset — Caps individual position risk
- 20-30 total positions — Provides adequate diversification
- Sector/Geography limits — Avoid concentration in correlated areas
- Quality spectrum — Mix conservative and speculative positions
Primary Risks:
- Extended Drawdowns — Assets can stay depressed for years
- Opportunity Cost — Capital locked in declining positions
- Liquidity Risk — Difficult exits during market stress
- Correlation Risk — Multiple positions declining simultaneously
5-Level Grid Structure: Mathematical weighting concentrates 77.4% of capital in the bottom two levels
Real-World Implementation
This strategy requires patience and discipline. Set up your grids with predetermined levels and position sizes, then execute mechanically without emotion when levels trigger.
Historical Context:
Amazon dropped 94.8% from $107 to $5.51 during the dot-com crash. Apple fell 54% from $7 to $3.19 in 2000-2002. Tesla crashed 73% from $407 to $109 in 2022. Grid strategies would have generated substantial profits from all these "disasters."
Execution Guidelines
Use limit orders at predetermined levels. Monitor for fundamental changes that might invalidate your thesis, but avoid adjusting grid parameters based on short-term market movements. The mathematical structure works through discipline, not discretion.
The Mathematical Advantage
The 5-level grid strategy transforms market crashes into systematic accumulation opportunities through pure mathematical structure. By concentrating capital at severely distressed prices, the strategy can generate profits even from fundamentally weak assets.
The key insight: this isn't about picking winners or timing markets. It's about mathematical position sizing that creates advantage through geometric scaling during severe drawdowns.
This strategy requires discipline, adequate capital reserves, and realistic expectations about both profits and losses. The mathematical structure is powerful but not magic - you can still lose significant money if assets decline further or fail completely.